Trace and audit
<< Server Properties/Log | IBExpert | Database Validation >>

Tutorial
This menu item supports the Firebird 2.5 Trace and audit services, initially developed from the TraceAPI contributed by Nickolay Samofatov that he had developed for Red Soft Database, a commercial product based on Firebird's code. This feature enables you to look inside the Firebird engine and log various events for real-time analysis. (This feature is unfortunately not included in the free IBExpert Personal Edition?.)
Two different kinds of traces can be performed: user traces and a system audit.
There are three general cases for use:
- Constant audit of engine activity
- Interactive trace of specified activity in specified database(s).
- Engine activity logging for a specified period of time (be it hours or a whole day) for later analysis.
Some of the supported statements include:
- CONNECT/DISCONNECT
- START/COMMIT/ROLLBACK of transactions
- PREPARE/START/FINISH/FREE of SQL statements
- START/FINISH of stored procedures and triggers
- Firebird 3 configuration syntax
- Firebird 3 log_function_start/log_function_finish
- Firebird 3 explain_plan
Analysis of large trace logs: The main idea is to retrieve only necessary items from a trace log file using the Grid View mode with applied filter criteria. It is also possible to save filtered data as a trace log file.
Nevertheless, an audit/trace does not replace the monitoring tables, because with the monitoring tables, the user can query a snapshot of the current state of a database, whereas an audit/trace can be compared with a sequential stream of logged statements. For example, if you wish to know the number of currently active transactions inside a database, simply query the MON$TRANSACTIONS table. With the audit/trace facility, this probably can only be done with advanced data analysis tasks on the log data stream (if at all).
The following scenarios are common examples for an audit/trace:
- Number of executed statements in a particular time period
- Execution trace for an existing (third-party) application (black-box debugging)
- Examiniation of performance problems when COMMIT RETAINING (soft commit) or COMMIT (hard commit) is used by your application
- Usage statistics for resource and load planning
- Logged statements as input for a security audit
Comparison of user and audit trace sessions
- User trace session: Each trace session has its own configuration, state and output and is managed by users. Trace sessions can be configured and controlled using this IBExpert menu item. Logged statements are stored on the server in a temporary file, until the initiating application fetches the trace data via the services API. A user trace does not stay alive when the Firebird server process gets restarted, but needs to be started manually again.
- Audit services: The system audit session is started by the Firebird engine itself. A parameter in firebird.conf, called AuditTraceConfigFile, points to the name and location of the trace configuration file, which is consulted every time a system audit session is started. By default, the value of this parameter is empty, indicating that no system audit tracing is configured. A configuration file contains list of traced events and points to the placement of the trace log(s) for each event. It is sufficiently flexible to allow different sets of events for different databases to be logged to separate log files. The template file fbtrace.conf, found in Firebird's root directory, contains the full list of available events, with format, rules and syntax for composing an audit trace configuration file. The system audit is described in detail in the Firebird 2.5 Release Notes.
The audit is built on top of the trace. The engine contains only trace sessions. However the functionality of the two session types are different:
| User trace | System audit |
|---|---|
| Always initiated by the user via a special service (application or similar). | Always initiated only by Firebird itself. |
| Many writers. | Many writers. |
| One reader. | No readers. |
| The log is not preserved after Firebird shutdown. | The log files are not deleted by Firebird. |
| Output is read by initiated service connection (the log starts and stops with session begin and end). | Output is stored in log file(s). |
| Log file name is set by Firebird. | The log file name can be set in the fbtrace.conf on a per-database (per-service) basis. It can be different for each database or the same for all databases. |
| Scope depends on the user privileges. | Scope is not limited. |
| Could be temporarily paused by Firebird when the temporary files are full. Is automatically resumed by Firebird as soon as room is available. | Never interrupted by Firebird. |
| Many user trace sessions may run simultaneously. Each user may start as many trace sessions as he needs. | Only one audit trace session can exist - Firebird starts it and stops it. |
| Can be managed (i.e. started and stopped) by the creator or SYSDBA. | Can only be managed by the SYSDBA. |
Using IBExpert's Trace and audit service
IBExpert's Trace and Audit can be started from the IBExpert Services menu:
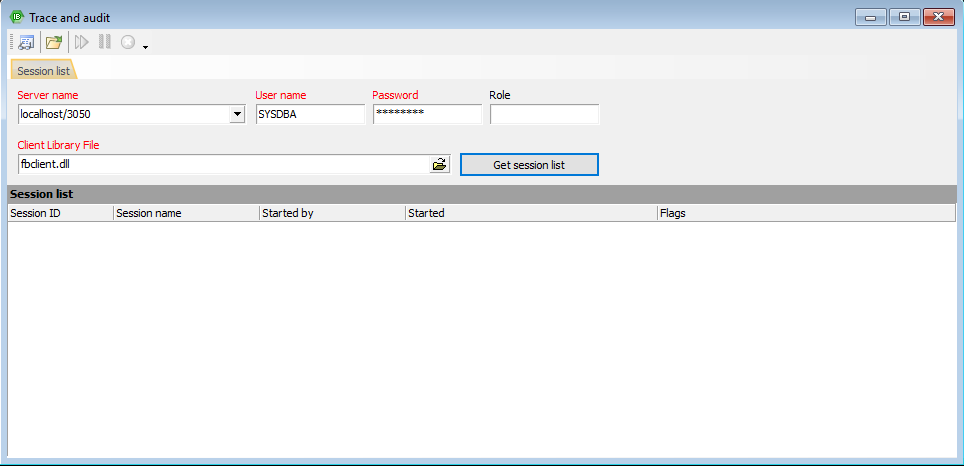
To load and analyze trace data from an existing file, simply click the Open File icon (second from the left in the toolbar). To start a new trace session, click the New trace session icon in the top left-hand corner to open the New trace session options window:
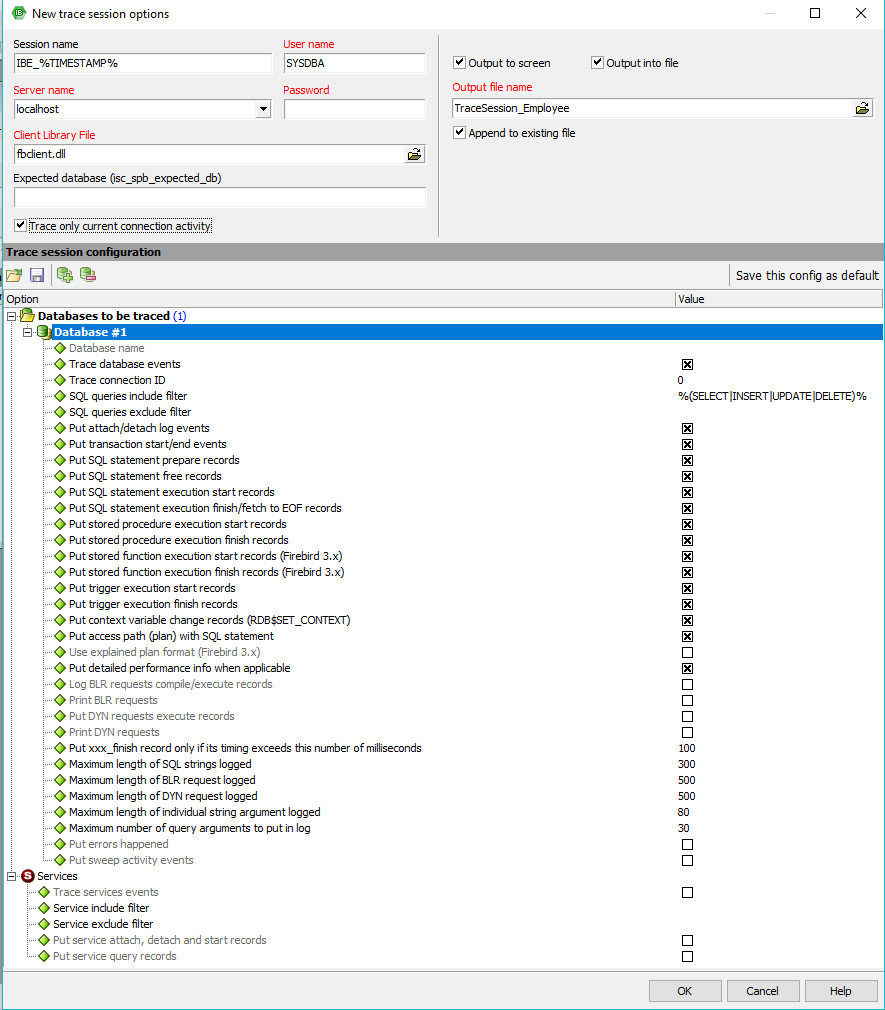
When configuring the trace, the configuration is processed from top to bottom. There are two sections allowed: database and services. The parameters can be stored as default and be used for all databases or services. Only one default section for each kind is allowed. After processing the default database section, the search is continued: if the database name matches the pattern, options are immediately applied and the search is not continued. The pattern is either the database name without a specified path or a SIMILAR TO-based regular expression which is matched against the fully-qualified database path name.
Firstly name the session (IBExpert already offers a default with automatically generated timestamp in the name). Specify user name, password, server path and which client library should be used. Finally specify whether the log output should be on-screen or to file (or both), before selecting which actions should be logged or not.
If the Trace only current connection activity option is on, IBExpert will substitute the Trace connection ID with the ID of the currently active connection to a database, as specified in Database name. In other words, only the current connection from IBExpert itself will be traced.
Select from the available options as follows:
Database
- Database name: select a registered database from the drop-down list.
- Trace database events: should be checked, otherwise nothing is traced. Default is true.
- SQL queries include filter: only SQL statements falling under the given regular expression are reported in the log.
- SQL queries exclude filter: SQL statements falling under the given regular expression are NOT reported in the log.
- Put attach/detach log events: sets the log_connections parameter in the fbtrace.conf file to true or false. Default is true.
- Put transaction start/end events: sets the log_transactions parameter to true or false. Default is true.
- Put SQL statement prepare records: sets the log_statement_prepare parameter to true or false. Default is true.
- Put SQL statement free records: sets the log_statement_free parameter to true or false. Default is true.
- Put SQL statement start records: sets the log_statement_start parameter to true or false. Default is true.
- Put SQL statement finish/fetch to EOF records: sets the log_statement_finish parameter to true or false. Default is true.
- Put stored procedure execution start records: sets the log_procedure_start parameter to true or false. Default is true.
- Put stored procedure execution finish records: sets the log_procedure_finish parameter to true or false. Default is true.
- Put trigger execution start records: sets the log_trigger_start parameter to true or false. Default is true.
- Put trigger execution finish records: sets the log_trigger_finish parameter to true or false. Default is true.
- Put context variable change records (RDB$SET_CONTEXT): sets the log_context parameter to true or false. Default is true.
- Put access path (plan) with SQL statement: sets the print_plan parameter to true or false. Default is true.
- Put detailed performance info when applicable: sets the print_perf parameter to true or false. Default is true.
- Log BLR requests compile/execute records: sets the log_blr_requests parameter to true or false. Default is false.
- Print BLR requests: sets the print_blr parameter to true or false. Default is false.
- Put DYN requests execute records: sets the log_dyn_requests parameter to true or false. Default is false.
- Print DYN requests: sets the print_dyn parameter to true or false. Default is false.
- Put xxx_finish record only if its timing exceeds this number of milliseconds: sets the time_threshold parameter in milliseconds. Default is 100.
- Maximum length of SQL strings logged: sets the max_sql_length parameter to maximum string length that should be logged. Default is 300.
- Maximum length of BLR request logged: sets the max_blr_length parameter to maximum BLR length that should be logged. Default is 500.
- Maximum length of DYN request logged: sets the max_dyn_length parameter to maximum DYN length that should be logged. Default is 80.
- Maximum length of individual arguments logged: sets the max_arg_length parameter to the maximum string length that should be logged. Default is 80.
- Maximum number of query arguments to put in log: sets the max_arg_count parameter to the maximum number of arguments that should be put in the log. Default is 30.
- Put errors happened:
- Put sweep activity events: Support for the log_sweep option (Firebird 2.5.2).
Note: the BLR and API traces are recommended for system audits. Restricting the length of statements helps to reduce the log size, as this can quickly become extremely large.
Services
- Trace services events: should be checked if you do not wish to limit your logging to one or more individual database(s). Default is true.
- Service include filter
- Service exclude filter
- Put service attach, detach and start records: sets the log_service parameter to true or false. Default is false.
- Put service query records: sets the log_service_query parameter to true or false. Default is false.
Once you have checked or unchecked all options as wished, you may save your settings as a conf file or click the Save this config as default on the right to overwrite the Firebird fbtrace.conf file.
You may then continue to add as many databases as you wish to log. Once this is complete simply click OK in the bottom right-hand corner. If you have checked the Output on screen option, IBExpert immediately goes to the Log page of the TraceServiceForm. A simple disconnect and reconnect shows the work the database engine is actually performing:
The first event logged is TRACE_INIT displaying the session number and session name. This command is issued for each new services connection.
The traces sessions can be viewed in text form or in a grid. Simply click the Grid view button in the toolbar, to view the data in tabular form:
in a Form View, or even print as a report. Detailed information regarding the Grid View can be found in the Table Editor chapter.
In Grid mode the Source/Details window allows you to view the source and details of each trace record. It can be displayed or hidden using the Show source/details icon to the right of the Grid view button. Trace data can also be exported from the Grid View mode.
To return to the Text view, reclick on the Grid View icon.
Regardless of which mode you prefer to work in, IBExpert offers a small context-sensitive menu when right-clicking on one of the tabs, offering the following options:
- Stop session
- Stop session and close this page
- New trace session.
Firebird Trace Manager
So how is this produced? Each database and service attachment contains its own private object, the Firebird Trace Manager. The Trace Manager has its own session objects for each trace session. There is a set of trace services, one of them being the StartTrace session. When a trace session is started it is put in the trace config storage which contains all the trace sessions. When an attachment has certain events to trace, it consults the trace config storage and starts the trace session in this particular attachment. It also stops and suspends/resumes any trace session. The SYSDBA is allowed to manage all trace sessions; a non-SYSDBA user is only allowed to manage his own sessions.
The trace config storage consists of two files: firstly fb_trace, the control file, mapped into shared memory and secondly, fb_trace_nnnn which is the storage of the trace sessions records (where nnnn is the temporary random name). These files store all the trace sessions records. Both files can be found in the Firebird lock directory (by default: COMMON_APPDATA\Firebird).
User trace output
The user trace output is stored in temporary log files, each with a small fixed size of 1MB, in the Firebird lock directory. These log files are created, administrated and deleted by Firebird directly. The maximum summary log file size can be specified in firebird.conf: MaxUserTraceLogSize = 10 (default value). This is the summary size, so that if the user application reads more slowly than Firebird produces output, the session will be paused after ten files (10MB) are loaded in the temporary memory. When the user application has then read a file, it can be deleted, freeing space so that Firebird can automatically resume the trace session.
If a Superserver or Superclassic process is shut down, any user trace session that were in progress, including any that were awaiting a resume condition, are fully stopped. This doesn't apply to Classic server as each connection involves it own dedicated server instance.
No service instance can outlive the connection that started it.
System audit trace output
The log output of a system trace output is stored simply in file(s) on the hard drive. The log file name is specified in the fbtrace.conf file on a per-database or per-service basis. Each log file can be rotated when its size reaches max_log_size in MB.
fbtracemgr
A new command-line utility, fbtracemgr, was introduced in Firebird 2.5 for working interactively with trace services. Please refer to InterBase® and Firebird command-line utilities for further information.
Source: Firebird Conference 2009, Munich, Germany: Trace and Audit Services in Firebird 2.5, Vlad Khorsun
This document includes excerpts taken from the German Entwickler Magazin article, Audit and Trace Services in Firebird 2.5: the new way to monitor database activity in Firebird 2.5. Copyright 2010 by Thomas Steinmaurer.
See also:
Firebird 2.5 Trace and Audit services
back to top of page
<< Server Properties/Log | IBExpert | Database Validation >>


